
Page 14 - QX Series
P. 14
INSIGHTqcx™ Cordless Controller Capabilities
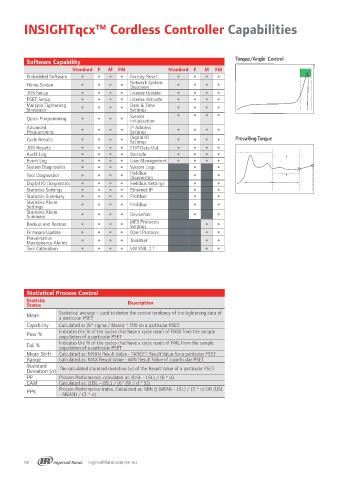
Torque/Angle Control
Software Capability
Standard F M FM Standard F M FM
Embedded Software Factory Reset
Home Screen Network System
Discovery
JOB Setup License Update
PSET Setup License Activate
Multiple Tightening Date & Time
Strategies Settings
Quick Programming System
Initialization
Advanced IP Address
Programming Settings
Cycle Results Digital IO Prevailing Torque
Settings
JOB Results EOR Data Out
Audit Log Barcode
Event Log User Management
System Diagnostics System Logs
Tool Diagnostics Fieldbus
Diagnostics
Digital IO Diagnostics Fieldbus Settings
Statistics Settings Ethernet IP
Statistics Summary ProfiNet
Statistics Alarm ProfiBus
Settings
Statistics Alarm DeviceNet
Summary
Backup and Restore MES Protocols
Settings
Firmware Update Open Protocol
Preventative ToolsNet
Maintenance Alarms
Tool Calibration VW XML 2.1
Statistical Process Control
Statistic Description
Status
Mean Statistical average - used to derive the central tendency of the tightening data of
a particular PSET
Capability Calculated as (6* sigma / Mean) * 100 on a particular PSET
Pass % Indicates the % of the cycles that have a cycle result of PASS from the sample
population of a particular PSET
Fail % Indicates the % of the cycles that have a cycle result of FAIL from the sample
population of a particular PSET
Mean Shift Calculated as: MEAN Result Value - TARGET Result Value for a particular PSET
Range Calculated as: MAX Result Value - MIN Result Value of a particular PSET.
Standard
Deviation (σ) The calculated standard deviation (σ) of the Result Value of a particular PSET.
PP Process Performance, calculated as: (USL - LSL) / (6 * σ)
CAM Calculated as: (USL - USL) / (6* (W / d * S))
PPK Process Performance Index, Calculated as: MIN (( MEAN - LSL) / (3 * σ) OR (USL
- MEAN) / (3 * σ)
14 IngersollRand.com/en-eu